PIPELINE4X RESEARCH REPORT · MARCH 2026
$3.7M–$12.8M
The Revenue Infrastructure Gap
B2B SaaS companies between $15M and $60M ARR lose $300K–$1M every month to four structural gaps in their revenue infrastructure
Built on research from 42 independent sources including Gartner, Harvard Business Review, SaaStr, Forrester, CSO Insights, and Bridge Group — representing data from 12,000+ sales leaders and organisations. Validated against a live $200M+ ARR, $2B valuation transformation.
91%
of companies miss
annual targets
8%
have strong sales/marketing
alignment
62%
see growth decline after
leadership change
72%
of revenue misses caused by architecture, not people
WHAT'S INSIDE
15 pages of institutional-grade benchmarks. Everything you need to know about your revenue infrastructure, and everything you need to fix it
This report consolidates 42 independent studies into a single cost model for scaling a company to over $200 million. It identifies the key structural gaps that cause B2B SaaS firms at $15M–$60M ARR to stall
01
Why Targets Get Missed
91% of B2B SaaS companies miss targets. When that happens, the answer is usually a new sales leader, New reps, a new methodology, or more budget. The infrastructure gaps remain unaddressed, and the cycle repeats itself. See what the 9% do that the others don't.
04
Four Infrastructure Gaps Behind the Numbers
Four gaps drive the leakage: sales and marketing misalignment, CRM data decay, informal sales process, and leadership turnover. Each of them exists at $15M–$60M ARR. Find them quantified here. Most don't know what they are until they see the number.
02
This Is Infrastructure, Not Talent
Only 8% of companies have strong alignment across SDR, Sales, and Marketing. The other 92% run on separate targets, definitions, rules and SLAs. 72% of revenue misses trace back to those infrastructure gaps. Not the people. See what aligned infrastructure looks like.
05
Convert Hero Culture into a Company Asset
62% of companies see growth decline after a leadership change. Leadership typically changes every 18 to 24 months, with each departure costing 6 to 9 months of momentum rebuilding and knowledge tax that could be avoided. Find out how.
03
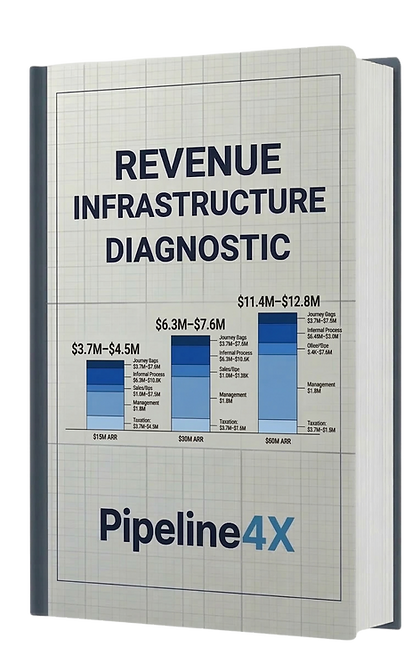
$300K–$1M in Monthly Leakage
Most companies know they could be doing better. They just can't put a cost number across SDRs, Marketing, and Sales. These gaps exist in every revenue band. See exactly how much they are costing yours.
06
Implement a Governed Recovery Roadmap
The four-pillar model. Strategy, Operations, People, and Systems. Each one installed in 90 days. At 80% recovery, a $30M ARR company gets back $5.6M in year one. Year two it compounds. Find out what the sequence looks like at your revenue band.
Benchmark Your Maturity. Quantify Your Monthly Leakage
“The Infrastructure Gap Report” shows you the data-driven market reality. The Diagnostic shows YOUR reality.
Benchmark your maturity across the four pillars of revenue. Identify exactly where your pipeline is leaking. In 10 minutes, you will know exactly how much ARR your infrastructure is costing you and what to fix first.
This Diagnostic is powered by the same Four-Pillar Model that supported:
$198M in generated pipeline
Over three years. Tested at a $2B valuation company.
Institutional stability
Where pipeline performance remained stable even after department heads departed